GIS Mapping
Weather based mapsGIS (Geographic Information Systems) is a powerful tool for interpreting and representing the data we collect. The ability to look at data represented on a map or chart can bring concepts and patterns into focus that might otherwise be lost when looking at raw data.
To purchase a high resolution image of any of the following maps, please contact us. WIN can also create customized maps to suit your needs.
Samples of WIN maps:
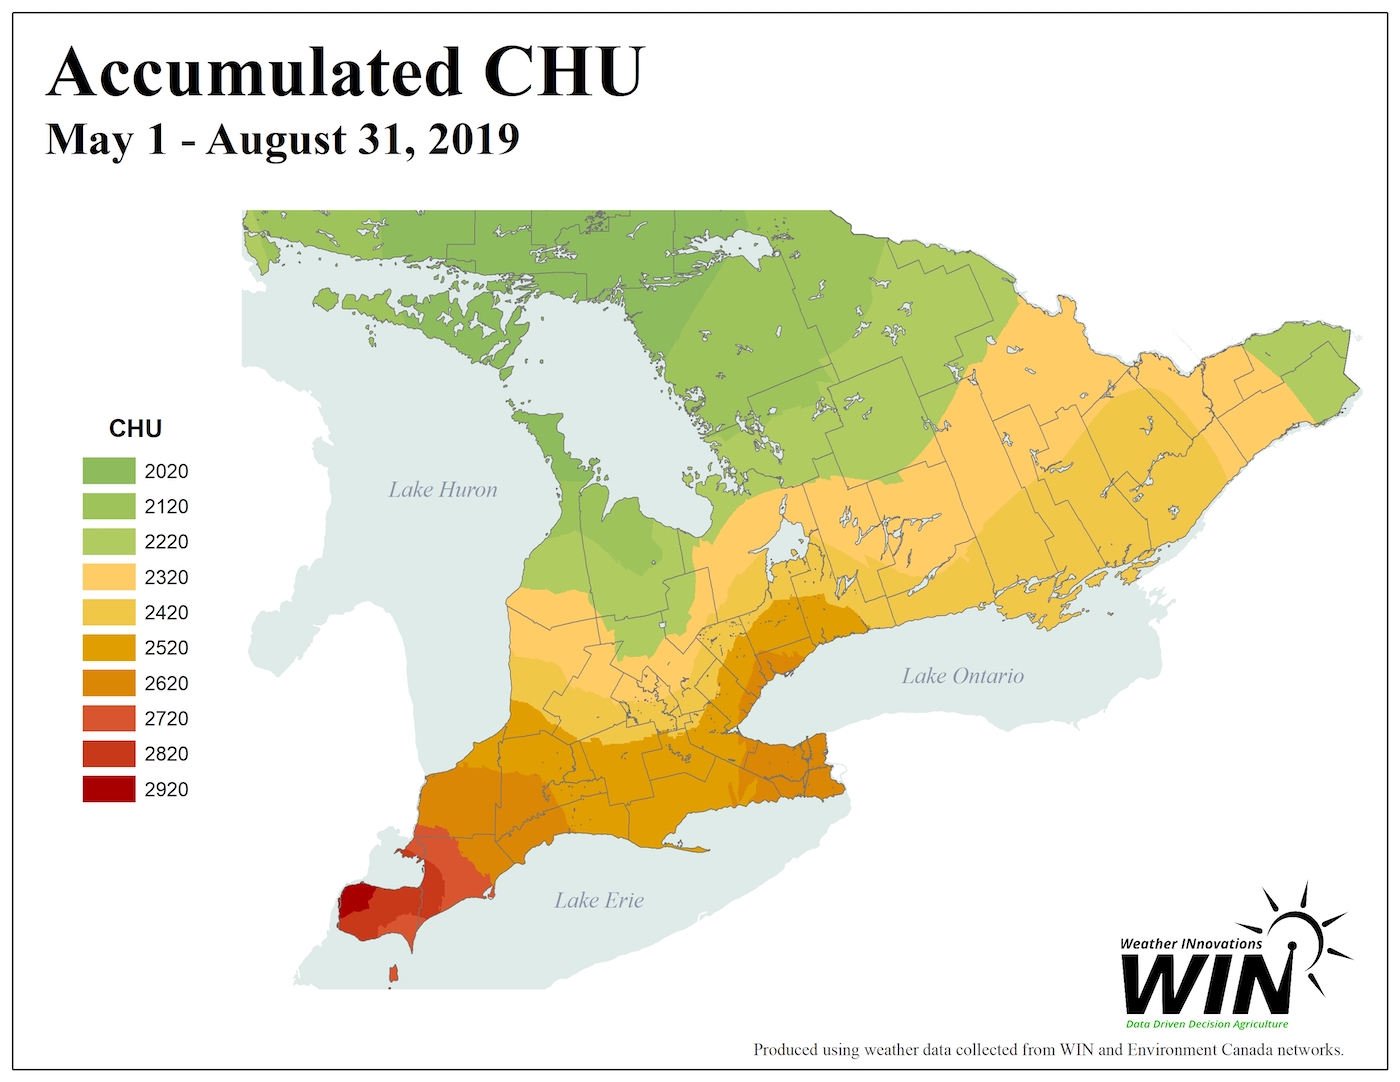
Crop Heat Units
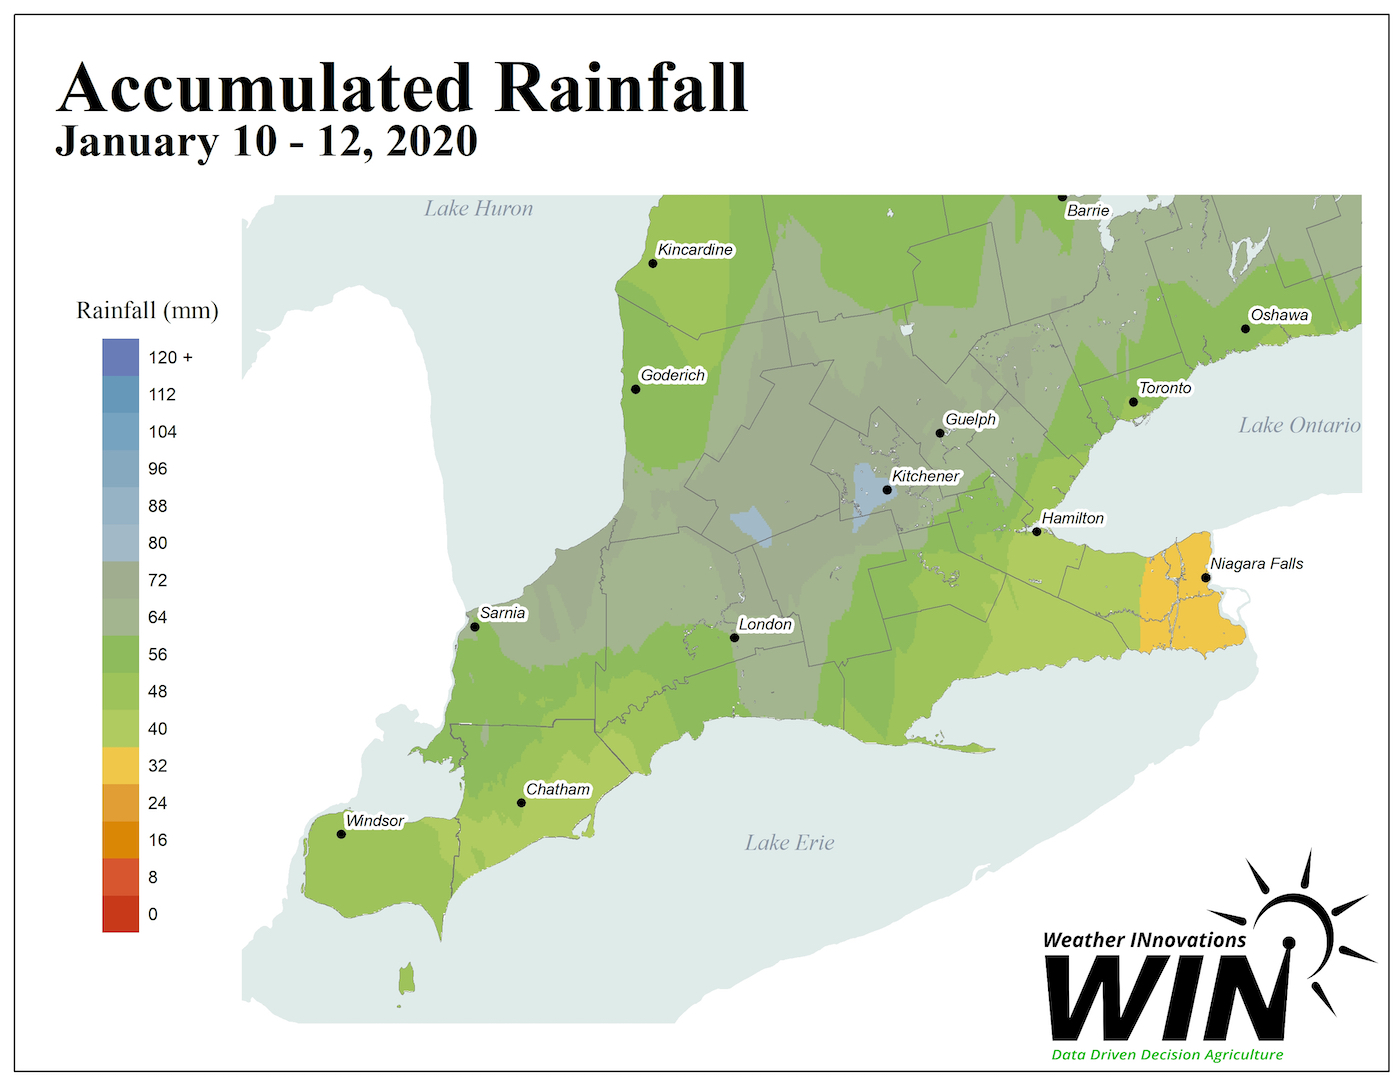
Accumulated Rain
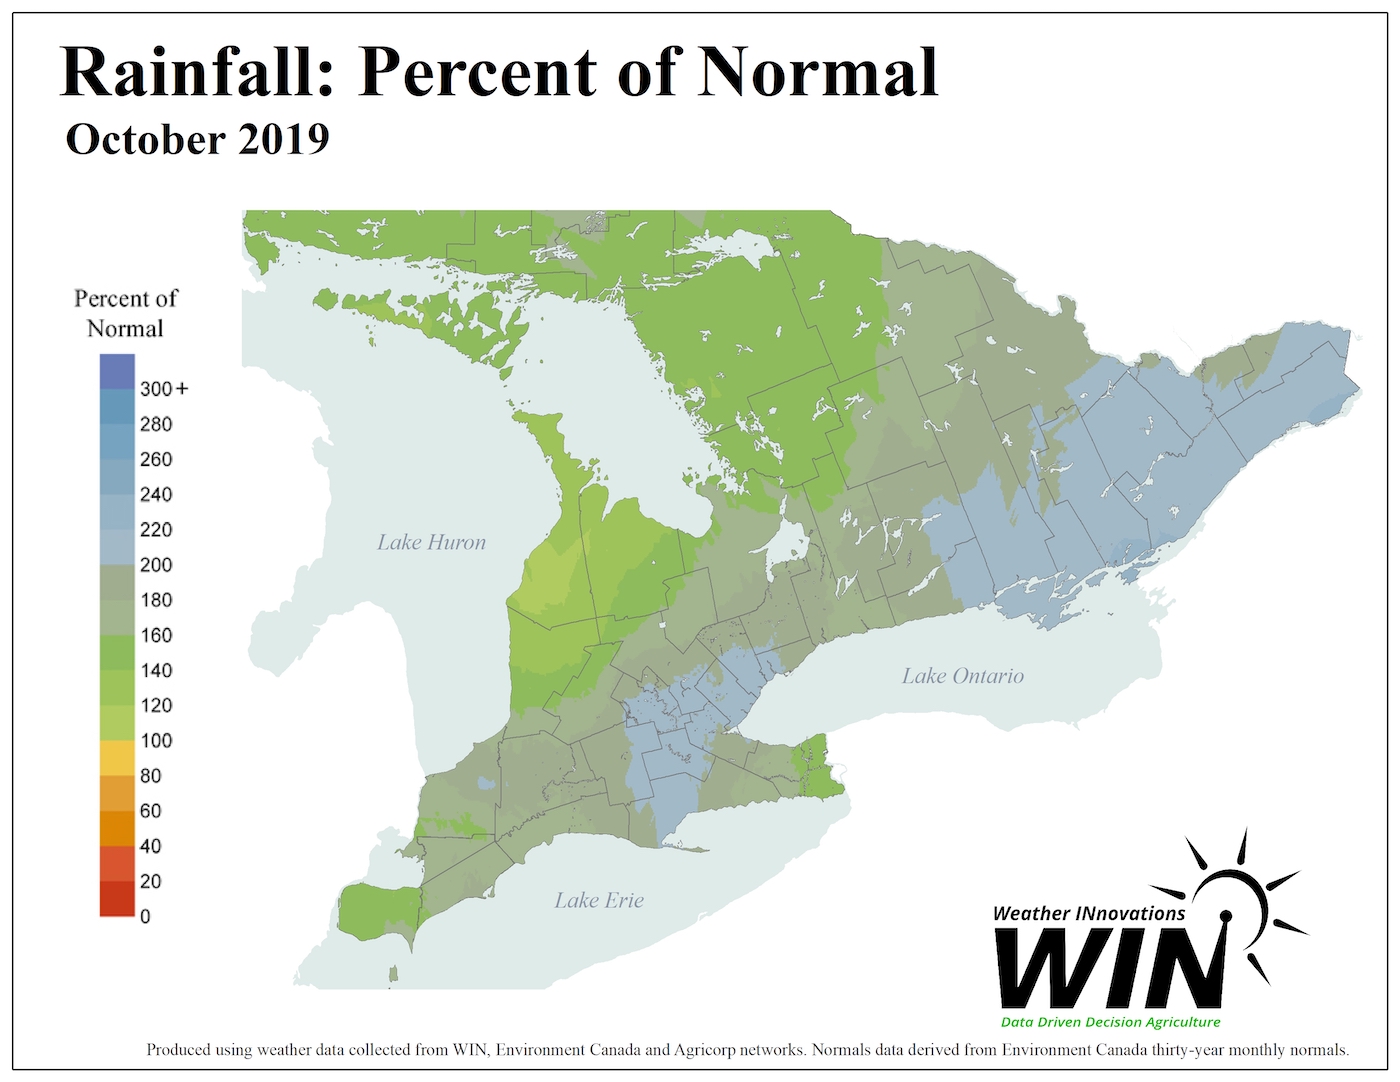
Rain Percent Normal